The most recent estimates suggest that human cells contain ~19,000 genes (Ezkurdia et al., 2014). That means that each of the billions of cells in your body have the instructions necessary to construct the same set of ~19,000 different proteins, each of which has a distinct sequence, shape, and function inside your body. However, while each cell has identical access to this wealth of information, no cell actually utilizes all of it. Each cell individually engages in a series of decision making events that carefully and precisely determine if a gene should be activated or silenced. But even after it makes all those ~19,000 different decisions, the cell isn’t done yet. It needs to dynamically respond to nearby cells and to its environment, meaning that each decisions may need to be revised at a moment’s notice.
For more than fifty years, scientists have been studying how the cell is able to rapidly and continually make these decisions, and which factors the cell weighs when coming to a decision. While we’ve learned a lot during that time, we remain unable to accurately predict how individual genes will respond to a given circumstance. What is clear is that the cell employs a multitude of different methods to regulate the activity of any single gene, meaning that the activation or silencing of a gene is the result of a careful synthesis of many diverse signals.
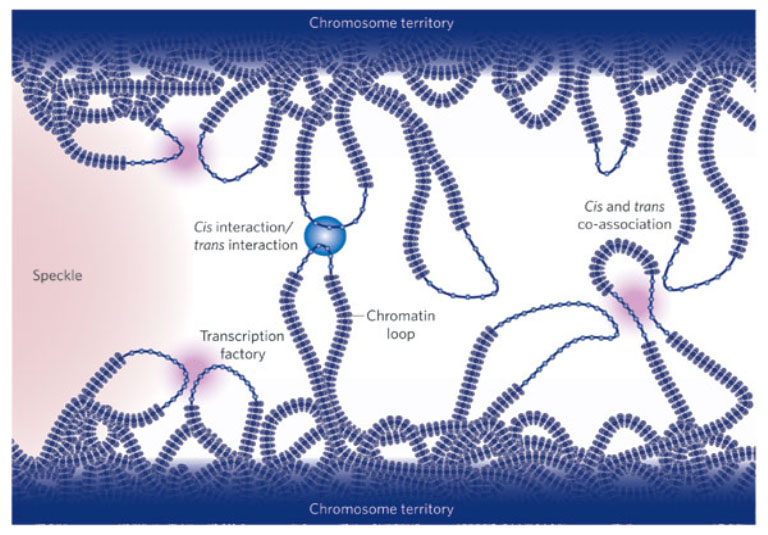
Figure adapted from: Fraser and Bickmore, 2007. This figure shows some of the potential chromatin configurations that a gene might be part of, and why this could lead to coordinated expression of multiple genes.
We are still very much in the process of discovering new and significant sources of regulatory information. Experiments in the last decade have increasingly demonstrated that the physical location of a gene within the nucleus, the compaction of the surrounding fiber of DNA (called chromatin), and the organization of nearby fibers can all be significant determinants of a gene’s expression. However, the consequences of specific chromatin configurations and the mechanisms that generate them are only beginning to be understood.
I study several proteins that influence the architecture and organization of chromatin fibers to better understand how these differences change the regulation of affected genes. Traditionally, this research would have been impossible to assay, or would have been addressed by in vitro experiments using purified proteins and reconstituted chromatin fibers. My research takes advantage of recent advances in quantitative microscopy and image processing to address these questions directly inside living cells.
The following sections include some more technical information about my specific projects, and the techniques I use.
Biophysical Characterization of Architectural Proteins:
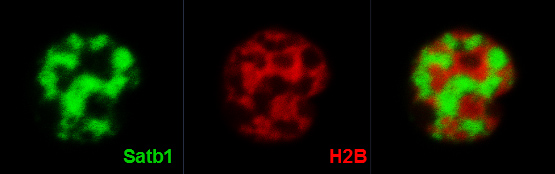
The distribution of Satb1 (in green) inside a developing thymocyte resembles a “cage-like” architecture: it fills the gaps between regions of tightly compacted chromatin (in red).
Architectural proteins are, in general, poorly characterized. They rarely have a defined DNA binding sequence, and with very few exceptions, it is unclear what effect these proteins have on the number and position of chromatin loops. This is all complicated by the fact that a single region of DNA isn’t being shaped by a single architectural protein. Rather, multiple different proteins are present, and the competition between them likely forms dynamic and short-lived loops. I primarily study two mysterious architectural proteins – Special AT-rich sequence Binding protein 1 and 2 (Satb1 and Satb2), which are involved in stem cell differentiation vs self-renewal (Savarese et al., 2009), T-cell maturation (Alvarez et al., 2000), and osteoblast maturation (Dobreva et al., 2006). Satb1 has been linked to tumor progression and metastasis in breast (Han et al., 2008), prostate (Mao et al., 2013), colorectal (Fang et al., 2013), liver (Tu et al., 2012), ovarian (Nodin et al., 2012), small cell lung (Haung et al., 2013), glioma (Chu et al., 2012), and other cancers. Ultimately, however, the role of Satb1 in cancer remains a highly controversial one.
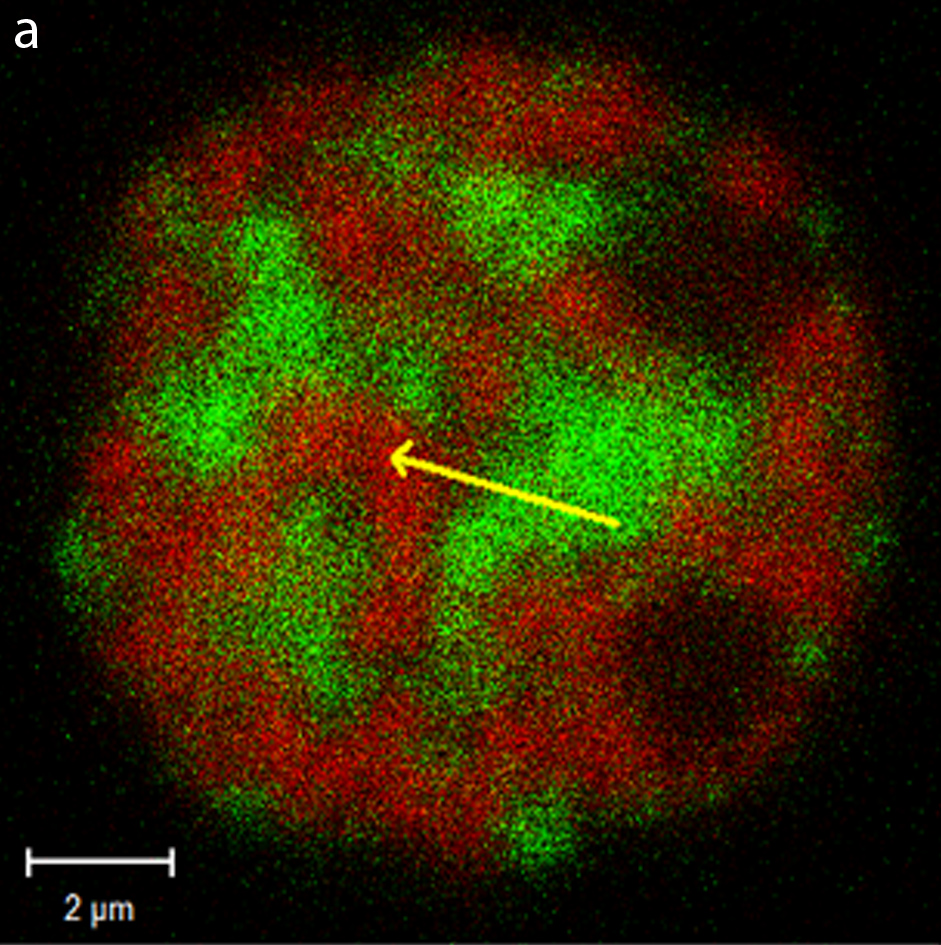
I use a number of different in vivo imaging techniques to probed the biochemical and biophysical properties of these two proteins, and discover how they compete with each other inside living cells. The techniques used include a number of different tradition and confocal imaging modalities, which include quantitative fluorescence recovery after photobleaching (FRAP), Förster resonance energy transfer (FRET), fluorescence correlation spectroscopy (FCS), and super resolution microscopy techniques such as photo activated localization microscopy (PALM).
The Impact of Local Chromatin Structure on Gene Regulation:
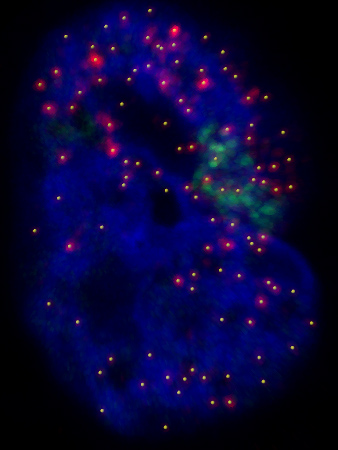
This is a projection of a Z-stack of images. Blue is DAPI (a DNA stain), green marks the location of the Lac array, red is the single molecule RNA FISH that allows us to detect and count individual transcripts, and the yellow dots are from our spot-picking algorithm.
Chromatin Configuration Capture (3C) assays have provided some information about how Satb1 is able to form or destroy specific chromatin loops in the β-globin (Wen et al., 2005) and TH2 cytokine (Cai et al., 2006) loci. However, in both situations, the relative contribution of Satb1 and other present chromatin architectural proteins like CTCF remains unclear. My research seeks to isolate the function of individual chromatin architectural proteins like Satb1 by directing them to a heterologous system in vivo that is relatively unaffected by the activity of other architectural proteins due to a lack of binding sites for mammalian proteins.
This heterologous system was developed in the laboratory of Andrew Belmont at the University of Illinois, Urbana-Champaign. It involves two mammalian cell lines that harbor a genomic integration of DHFR cDNA whose expression is driven by a SV40 promoter followed by 256 direct repeats of the 32bp lac operator. This sequence was replicated by methotrexate-based gene amplification, and individual cell lines were established from clonal populations (Robinett et al., 1996; Verschure et al., 2005). The presence of the lac operator allows for these sequences to be visually characterized by the expression of a EGFP-Lac Repressor (LacR) fusion protein, and it also allows for the precise targeting of chromatin architectural proteins like Satb1, Satb2, and CTCF. Carefully monitoring of the position of these lac operator arrays shows what large-scale architectural changes are being made to these sequences.
I am also able to monitor changes to the expression of the DHFR gene through the use of single molecule RNA Fluorescence In Situ Hybridization (FISH) on A03 and RREB1 cells. This recently developed technique is able to detect individual RNA molecules through hybridization of multiple singly-labeled probes to an single transcript (Raj et al., 2008). This provides a precise count of the number of DHFR transcripts that exist within a particular cell.
Consequences of Global Genome Reorganization:
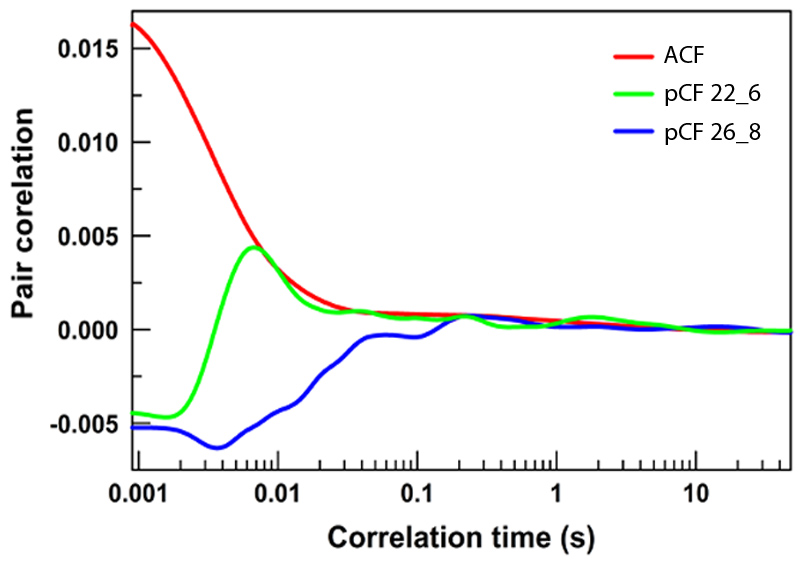
Shown are examples of three different forms of analysis for a given pixel. In red is a single pixel correlated to itself over time. It starts off highly correlation, but over time those molecules move, and the correlation decreases. Slow moving molecules will stay correlated longer. In blue is now comparing two pixels – they never become correlated and so no molecules move between these during the experiment. Finally, in green is an analysis between two pixels which did experience molecular movement.
The activity of chromatin architectural proteins like Satb1 and CTCF is not confined to small localized regions of DNA – their great abundance of binding sites scattered throughout the genome (some close to promoters, but others quite distant) suggest that their expression causes wide-spread changes to how the entire genome is organized. And while it is still uncertain to what degree global chromatin architecture is meaningful to the function and activity of the cell, it is known that the local density of DNA alters the diffusive route of inert molecules, but not their rate of diffusion, in the nucleus (Hinde et al., 2010). These molecules preferentially stay within regions of similar DNA density, and only rarely transit to zones of drastically different density.
The frequency of molecular transit across this boundary can be assayed using by confocal microscopy and data analysis using a spatial pair cross-correlation function (pCF) which correlates the intensity fluctuations at one pixel with those occurring at a distant pixel (Digman and Gratton, 2009). In this analysis, the intensity fluctuations at these pixels will have no cross-correlation or will be negatively correlated at short time scales, but may eventually become positively correlated. This indicates that fluorescent molecules departing from the first pixel have arrived at the second. My research looks into the degree to which the cell can control the frequency of molecular transit from high- to low-density chromatin through the use of chromatin remodelers, and how such changes impact gene expression.
My work would not be possible without financial support from the NIH, and the NCI’s Physical Science in Oncology initiative. My mentors at UC Berkeley, Jan Liphardt (who is now at Stanford University) and Carlos Bustamante provided essential technical and scientific expertise which immeasurable improved the work. Finally, all of this research has been done in close collaboration with Dr. Rajashi Ghosh and Dr. Quanming Shi, and I am immeasurably thankful for their camaraderie, sincere dedication, and keen intellects. This research would not have been possible without their contributions.